USGS 415941111175401 Bear Lake nr east shore 0.4 mi S of UT-ID border

PROVISIONAL DATA SUBJECT TO REVISION

Click to hidestation-specific text
USGS station 415941111175401
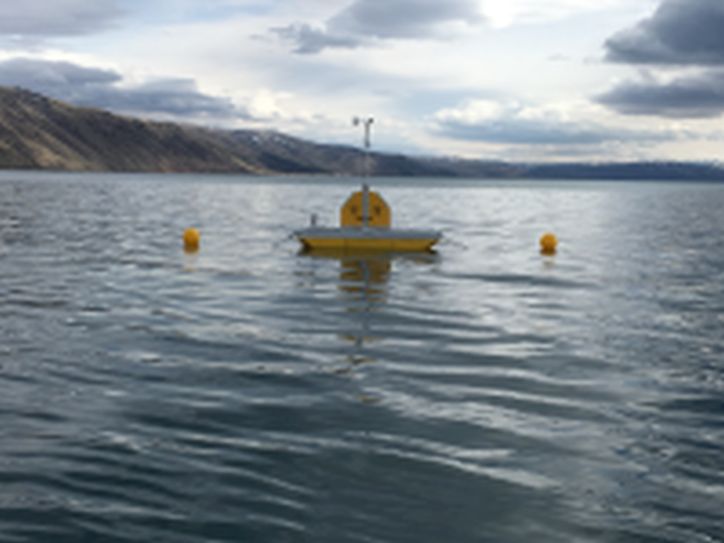
Station operated by the U.S. Geological Survey, with Cooperative Matching Funds with Utah Department of Environmental Quality, Idaho Department of Environmental Quality, PacifiCorp, and Bear Lake Watch. Water quality data provided here are from an automated water quality profiling station. A data visualization tool that provides time series color maps of water quality profile data is available on the project webpage at https://www.usgs.gov/centers/ut-water/science/bear-lake-water-quality?qt-science_center_objects=1#qt-science_center_objects.
Additional station information.
This station managed by the Salt Lake City Field Office.

Available Parameters Available Period
  
2021-05-01  2024-04-25
2021-05-01  2024-04-30
2021-05-01  2024-04-30
2021-05-01  2024-04-30
2021-05-01  2024-04-25
2021-05-01  2024-04-25
2021-06-11  2024-04-25
2021-05-01  2024-04-25
2021-05-01  2024-04-25
2021-05-01  2024-04-30
2021-05-01  2024-04-25
2021-05-01  2024-04-25
2021-05-01  2024-04-30
2021-05-01  2024-04-30
2021-05-01  2024-04-30


 (7)
 

  -- or --


Summary of all available data for this site
Instantaneous-data availability statement


Temperature, water, degrees Celsius

Most recent instantaneous value: 6.8 04-25-2024   18:01 MDT
Graph of  Temperature, water, degrees Celsius

Add up to 2 more sites and replot for "Temperature, water, degrees Celsius"

?


Create presentation-quality / stand-alone graph.   Subscribe to WaterAlert      

See this graph on the Monitoring Location Pages


Specific conductance, water, unfiltered, microsiemens per centimeter at 25 degrees Celsius

Most recent instantaneous value: 678 04-25-2024   18:01 MDT
Graph of  Specific conductance, water, unfiltered, microsiemens per centimeter at 25 degrees Celsius

Add up to 2 more sites and replot for "Specific conductance, water, unfiltered, microsiemens per centimeter at 25 degrees Celsius"

?


Create presentation-quality / stand-alone graph.   Subscribe to WaterAlert      

See this graph on the Monitoring Location Pages


Dissolved oxygen, water, unfiltered, milligrams per liter

Most recent instantaneous value: 10.4 04-25-2024   18:01 MDT
Graph of  Dissolved oxygen, water, unfiltered, milligrams per liter

Add up to 2 more sites and replot for "Dissolved oxygen, water, unfiltered, milligrams per liter"

?


Create presentation-quality / stand-alone graph.   Subscribe to WaterAlert      

See this graph on the Monitoring Location Pages


pH, water, unfiltered, field, standard units

Most recent instantaneous value: 8.6 04-25-2024   14:57 MDT
Graph of  pH, water, unfiltered, field, standard units

Add up to 2 more sites and replot for "pH, water, unfiltered, field, standard units"

?


Create presentation-quality / stand-alone graph.   Subscribe to WaterAlert      

See this graph on the Monitoring Location Pages